
Now that you’ve successfully implemented k-means clustering and ran it on 2-dimensional data, we will now use it on a clustering of 784-dimensional data points with 10 centroids to identify hand-written numbers. We will apply the algorithm to a real world data set known as the Modified National Institute of Standards and Technology database (MNIST), which contains images of hand-written digits. For this assignment, we are only using a small subset of the dataset. Here are nine example images:
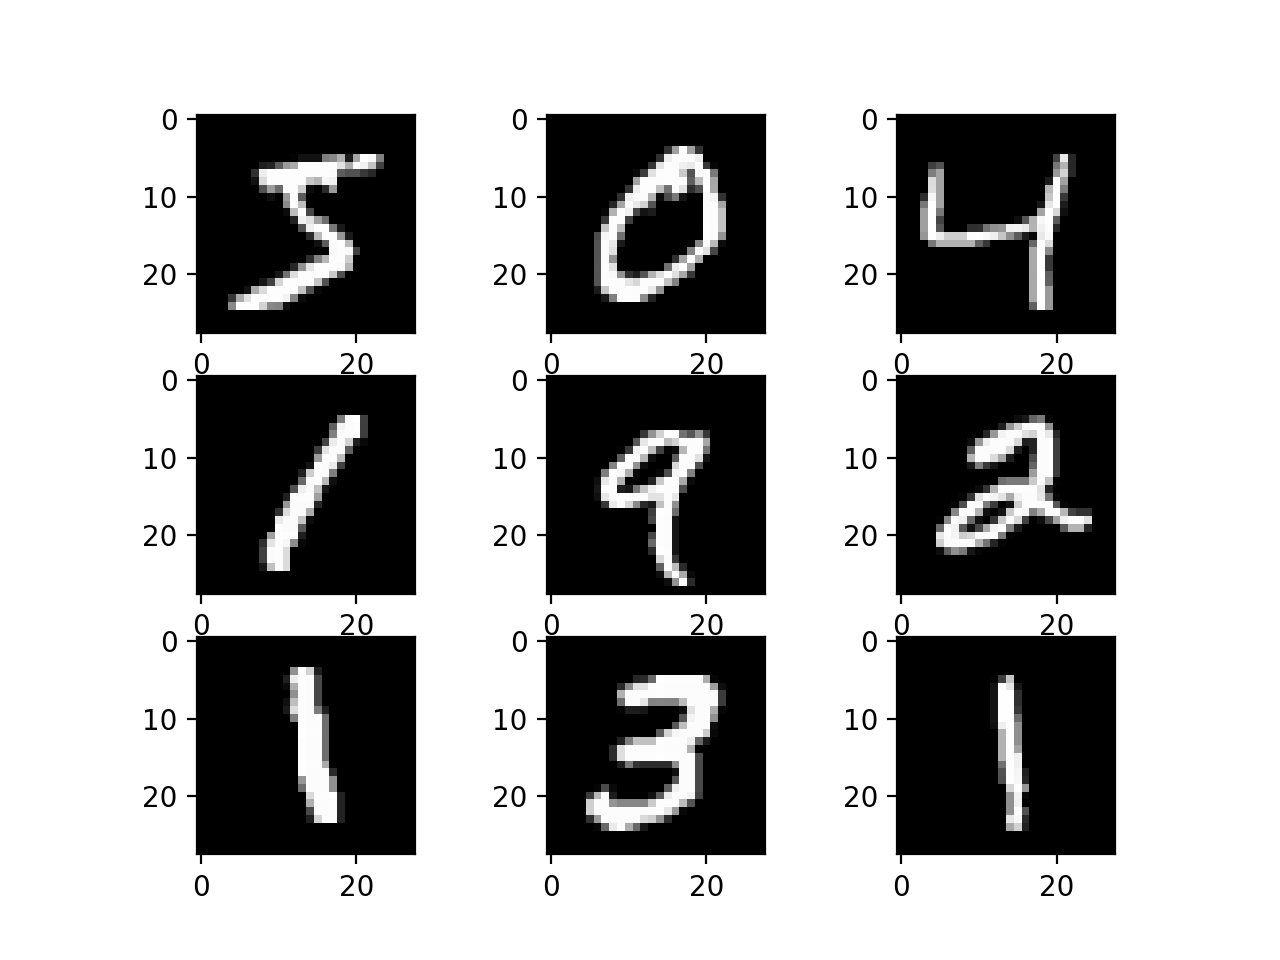
Each of these images is 28 pixels by 28 pixels, for a total of 784 pixels. Each image can be thought of as a 784-dimensional data point, represented as a list containing 784 numbers. For the images shown above, many of the numbers would be zero since the image is mostly black.
To load the MNIST dataset instead of the 2D points, change the code at the bottom of the kmeans.py to the following:
if __name__ == '__main__':
    # main_test()

    data, label = read_data("data/mnist.csv")
    init_c = load_centroids("data/mnist_init_centroids.csv")
    final_c = main_mnist(data, init_c)
    write_centroids_tofile("mnist_final_centroids.csv", final_c)
You should leave the rest of your code un-changed and it should run with the new data without errors. Run this command again (it may take a minute to run on this data set): python kmeans.py
You should see the following output:
K-means converged after 18 steps.
In the results/MNIST folder, the init and final folders should be filled with the centroids plotted as images.
In the init folder, the centroids should look like random pixels (left below), because that’s how we randomly initialized them. In the final folder, they should look like actual digits (right below), after similar data points (images) have been clustered together.
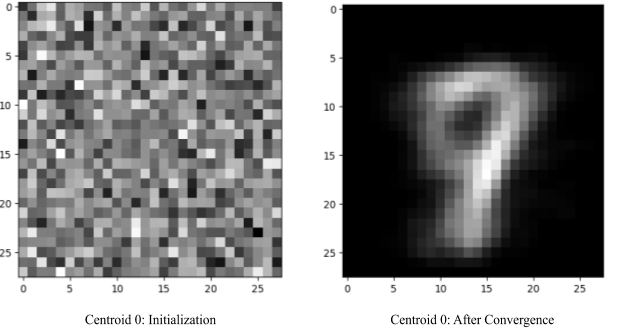
This shows that K-means has adjusted the locations of the centroids from our random initialization to a more meaningful space that corresponds to where the MNIST data is distributed.
Analyzing the Performance
Info
The images in the MNIST data set have been labeled with the digit they actually represent — you can see this label as the digit in the first column on each row in mnist.csv. Each row of that file represents one data point.
One way to evaluate our algorithm would be to examine the accuracy of the classification of the images from MNIST. For example, how many of the images labeled as the digit 4 ended up in the centroid that represents the digit 4?
First, let’s define the “classifications” of our data points provided by k-means clustering by taking a majority-takes-all approach: we assign each cluster a label as the majority labels of all data points in this cluster. For example, if we have data points with these labels assigned to cluster1: 2, 2, 2, 2, 2, 2, 8, 6, 2, 2, 6, 8, 8, 2, 2.
Since there are 10 2s, 3 8s, and 2 6s, we say the label of cluster1 is 2 since it is the majority label (i.e the first six images have a label of 2), the seventh image has a label of 8, and the eighth image has a label of 6.
We can then define the accuracy of the classification for a centroid as:
accuracy=number of majority labelsnumber of labelsaccuracy=number of labelsnumber of majority labels?
In our example, the majority label is 2, there are 10 label 2’s, and there are 15 labels in total. So we say the accuracy for cluster1 is:
accuracy=1015=0.667accuracy=1510?=0.667
To determine the accuracy of our algorithm, we’ll figure out the majority label for a cluster and keep track of the count of the majority labels for every cluster in our dataset. The accuracy of the algorithm is then defined as:
accuracy=sum of count of majority labels in all clusterstotal number of labelsaccuracy=total number of labelssum of count of majority labels in all clusters?
We will implement the analysis code in a different file, analysis.py.
Load the final centroids: what happened?
We have provided some starter code for you near the bottom of analysis.py:
if __name__ == "__main__":
    centroids = load_centroids("mnist_final_centroids.csv")
    # Consider exploring the centroids data here

    # main_test()

    # data, label = read_data("data/mnist.csv")
    # print(accuracy(data, label, centroids))
Take a closer look at this centroids dictionary and the images that were generated by using print statements. How many centroids are there in the dictionary now? In Part A, we initialized the algorithm with 10 randomly chosen positions as the initial centroids. Why are there fewer centroids than 10 now? What do you suspect happened? Leave your answers as comments at the bottom of the file (analysis.py).
Modify update_assignment
When we implemented the update_assignment() function in kmeans.py, it assigned each data point to the centroid it is closest to. This works great for our k-means clustering, but now we are not only interested in which centroid the data point is assigned to, but also the true label of that data point in order to perform the accuracy analysis.
Copy over update_assignments() from kmeans.py and implement a modified version of update_assignment() in analysis.py to return a different value:
def update_assignment(list_of_points, labels, centroids_dict):
    """
    Assign all data points to the closest centroids and keep track of their
    labels. The i-th point in "data" corresponds to the i-th label in "labels".

    Arguments:
        list_of_points: a list of lists representing all data points

        labels: a list of ints representing all data labels
                labels[i] is the label of the point list_of_points[i]
        centroids_dict: a dictionary representing the centroids where the keys
                        are strings (centroid names) and the values are lists
                        of centroid locations

    Returns: a new dictionary whose keys are the centroids' key names and
    values are a list of labels of the data points that are assigned
            to that centroid.

    Example:
        Code:
            list_of_points = [[1.1, 1, 1, 0.5], [4, 3.14, 2, 1], [0, 0, 0, 0]]
            labels = [2, 1, 3]
            centroids_dict = {"centroid1": [1, 1, 1, 1],
                            "centroid2": [2, 2, 2, 2]}
            print(update_assignment(list_of_points, labels, centroids_dict))
        Output:
            {'centroid1': [2, 3], 'centroid2': [1]}
    """
Instead of nested lists of data points as the values of the dictionary returned, it should now be single lists that contain the labels of the data points, not the actual data points. Just like kmeans.py, we have provided tests for you to verify your implementation. Uncomment the call to main_test() near the bottom of analysis.py and then run python analysis.py in the terminal.
You should see the following output once you have correctly implemented update_assignment():
test_update_assignment passed.
Calculate the count of the majority label
Implement majority_count() to return the count of the majority label:
def majority_count(labels):
    """
    Return the count of the majority labels in the label list

    Arguments:
        labels: a list of labels

    Returns: the count of the majority labels in the list
    """
You should see the following output once you have correctly implemented majority_count():
test_majority_count passed.
Calculate the accuracy of the algorithm
Use the two functions you implemented in the previous parts of Part 2 to calculate the accuracy for every cluster and the whole algorithm, defined as above in the Analyzing the Performance section.
Use update_assignments() and majority_count() to implement accuracy() to calculate the accuracy of our k-means clustering algorithm:
def accuracy(list_of_points, labels, centroids_dict):
    """
    Calculate the accuracy of the algorithm. You
    should use update_assignment and majority_count
    (that you previously implemented)

    Arguments:
        list_of_points: a list of lists representing all data points
        labels: a list of ints representing all data labels
                labels[i] is the label of the point list_of_points[i]
        centroids_dict: a dictionary representing the centroids where the keys
                        are strings (centroid names) and the values are lists
                        of centroid locations

    Returns: a float representing the accuracy of the algorithm
    """
You should see the following output once you have correctly implemented accuracy():
test_accuracy passed.
At this point, if you completed all parts to analysis.py you should see following output when you run the tests:
all tests passed.
Run analysis and think about the results
You have now completed all the parts required to run the analysis. Please de-comment the last few commented lines of code at the bottom of analysis.py and comment out the call to main_test() (and remove your exploration code from Step 1) so you have:
if __name__ == "__main__":
    centroids = load_centroids("mnist_final_centroids.csv")

    # main_test()

    data, label = read_data("data/mnist.csv")
    print(accuracy(data, label, centroids))
And run the program by typing python analysis.py.
Note that the file name returned in the output does not necessarily correspond with the label assigned to the digit (ex. centroid0.png is not necessarily an image of ‘0’). Instead, decide on the label of the image by looking at the returned image itself. What is the output? Is this value surprising? It might be helpful to take another look at the final centroid images from MNIST in the results/MNIST/final folder.
In your opinion, based on these centroids, which digits are easier to be distinguished by the algorithm, and which are harder? If you can’t tell from the centroid images, consider printing the accuracy for each label inside of your accuracy function. Reasonable answers will receive full credit. (i.e, 2-3 sentences). Leave your answer as comments at the bottom of the file analysis.py.