
Problem 1: Remove Some Lines
Run dna_analysis.py in the terminal on test-small.fastq like you did for Problem 0. Be sure to take note of what output appears in the terminal. Then comment out the line gc_count = 0 by putting a # at the start of the line. Save the file and then run it again in the terminal.
In answers.txt, explain what happened, and why it happened.
Now, restore the line to its original state by removing the # that you added. What would happen if you commented out this line instead? nucleotides = filename_to_string(file_name)
Explain what happens and why in answers.txt.
Problem 2: Compute AT Content
Modify your program so that, in addition to computing and printing the GC ratio, it also computes and prints the AT content. The AT content is the percentage of nucleotides that are A or T.
There are two ways to compute the AT content:
- Copy the existing loop that examines each nucleotide and modify it. You will now have two loops, one of which computes the GC count and one of which computes the AT count.
- Add more statements into the existing loop, so that one loop computes both the GC count and the AT count.
You may use whichever approach you prefer. Check your work by manually computing the AT content for test-small.fastq, then comparing it to the output of running your program on test-small.fastq.
Run your program on sample_1.fastq. Copy and paste the relevant line of output into answers.txt.
Problem 3: Count Nucleotides
Info
At this point you should also feel free to modify the code we have given you if another structure of if statements makes more sense to you. We just caution you against looping through the data more times than you need to as this could cause your code to run very slowly.
Modify your program so that it also computes and prints the number of A nucleotides, the number of T nucleotides, the number of G nucleotides, and the number of C nucleotides.
When doing this, add at most one extra loop to your program. You can solve this part without adding any new loops at all, by reusing an existing loop.
Check your work by manually computing the results for file test-small.fastq, then comparing them to the output of running your program on test-small.fastq.
Tip
You can use the up-arrow key in the terminal window to retrieve commands you ran previously.
Run your program on sample_1.fastq. Copy and paste the relevant lines of output into answers.txt (the lines that indicate the G count, C count, A count, and T count).
Problem 4: Sanity-Check the Data
Debugging
Modify dna_analysis.py so that it will calculate and print the following variables:
sum_counts: the sum of the A count, the C count, the G count, and the T counttotal_count: the total number of nucleotideslen_nuc: the length of the nucleotides string variable usinglen(nucleotides).
Then run dna_analysis.py on each of the 11 .fastq files provided. As you run these files, you’ll notice that at least one of these quantities will be different from the other two for at least one .fastq file.
In answers.txt, state which .fastq file(s) and which quantities produce different results. Also write a short paragraph that explains why these differ.
If all the three quantities you measured are the same, then it would not matter which one you used in the denominator when computing the GC content. However, you saw that the three quantities are not all the same. In answers.txt, state which of these quantities should be used in the denominator and which should not, and why.
If your program incorrectly computed the GC content, which should be equal to
then state that fact in answers.txt. Go back and correct your program, **and also update any incorrect answers elsewhere in answers.txt. It is fine to change the code we provided you if needed.
Note
If you are unsure if you are calculating things correctly, now would be a good time to validate your dna_analysis.py program’s output using the Diff Checker (be sure that you select the entire line as it will show differences in trailing spaces as a difference). You can compare your output to the files given in the expected_output directory of the homework2 files. You have not yet completed the assignment, so your output will not be identical. But things like GC-content, AT-content, and individual counts should be identical. You will produce the last two lines of output in the expected_output files in Problem 7 and Problem 8 below.
Problem 5: Compute the AT/GC ratio
Sometimes biologists use the AT/GC ratio, defined as,
Modify your program so that it also computes the AT/GC ratio. This should be calculated as: (A count + T count) / (G count + C count).
Check your work by manually computing the results for file test-small.fastq. Compare them to the output of running your program on test-small.fastq.
Run your program on sample_1.fastq. Copy and paste the relevant lines of output into answers.txt on the line that indicates the AT/GC ratio.
Problem 6: Categorize Organisms
The GC content can be used to categorize microorganisms. Fill in the body of the classify function to return the classification of the organism (“high”, “moderate” or “low”) described in the data file given using these classifications:
- If the GC content is above 58%, the organism is considered “high GC content”.
- If the GC content is below 35%, the organism is considered “low GC content”.
- Otherwise, (the GC content is between 35% and 58% inclusively), the organism is considered “moderate GC content”.
Info
Even though the classification message that should be printed to the screen (as seen in the expected output files) will be “high GC content”, “low GC content”, or “moderate GC content”, your function should only return the values “high”, “moderate” or “low”.
Biologists can use GC content for classifying species, for determining the melting temperature of the DNA (useful for both ecology and experimentation, for example PCR is more difficult on organisms with high GC content), and for other purposes. Here are some examples:
- The GC content of Streptomyces coelicolor A3(2) is 72%.
- The GC content of Yeast (Saccharomyces cerevisiae) is 38%.
- The GC content of Thale Cress (Arabidopsis thaliana) is 35%.
- The GC content of Plasmodium falciparum is 20%.
Again, test that your program works on some data files with known outputs. The test-small.fastq file has low GC content. We have provided four other test files, whose names explain their GC content: test-moderate-gc-1.fastq, test-moderate-gc-2.fastq, test-high-gc-1.fastq, test-high-gc-2.fastq.
You will find starter code for the classify() function near the top of dna_analysis.py, just before where the main program begins. There is an assignment statement inside the function body that is there only as a placeholder.
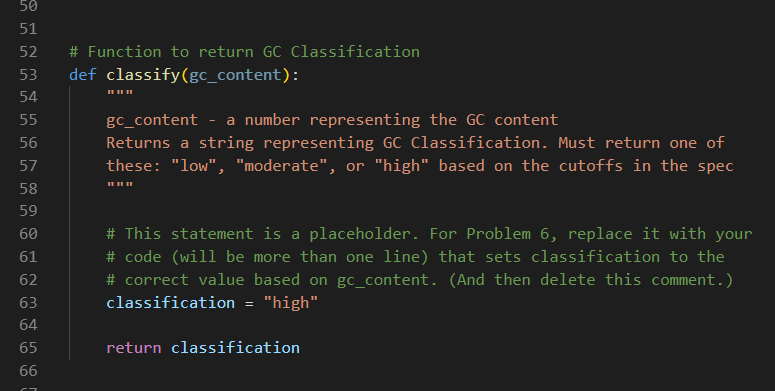
The function classify takes the gc_content as an input parameter and returns an appropriate string indicating the GC Classification. Once you have filled in the body of the classify function you should call the function from your main program in the appropriate place and use the string it returns to print out a message that matches what is expected. For example, be sure that your output for test-moderate-gc-1.fastq matches test-moderate-gc-1-expected.txt exactly using Diff Checker.
After your program works for all the test files, run it on sample_1.fastq. Copy and paste just the relevant line of output from your program into answers.txt (the line that indicates the GC classification).